
Energy Consumption Tree Map Chart Template
Unleash Your Creativity: Design Your Own Energy Consumption Tree Map Chart
 100% customizable templates
 Millions of photos, icons, charts and graphics
 AI-powered editing features
 Effortlessly share, download, embed and publish
 Easily generate QR codes for your designs
- SizeCustom (1200 x 1200 px)
- File typePNG, PDF, PowerPoint
- Planfree
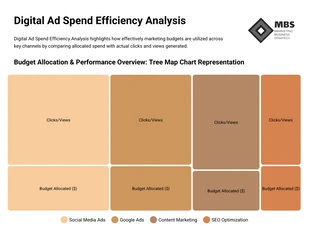
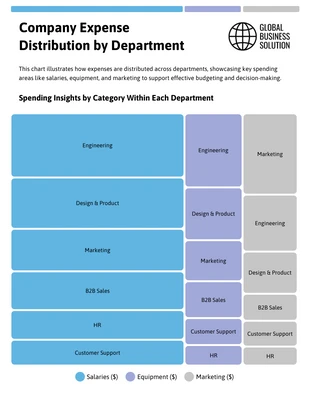
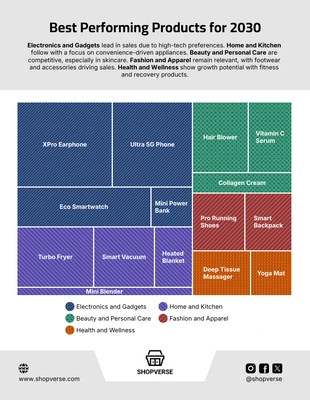
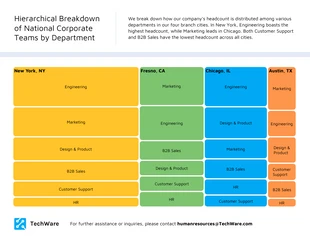
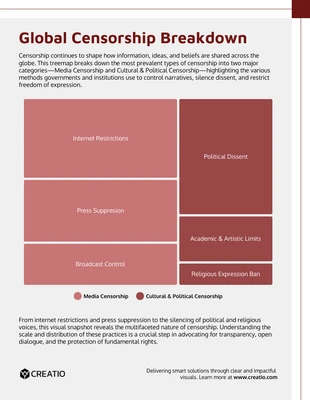
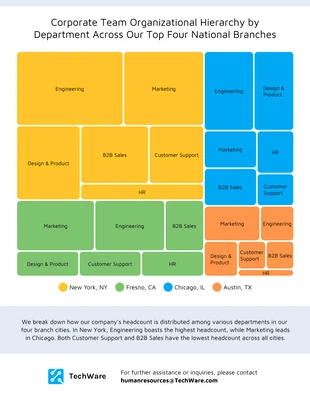
Our Energy Consumption Tree Map Chart Template is a dynamic and visually engaging tool to showcase how energy is used across different sectors or systems. Perfect for reports, presentations, or educational materials, this template allows you to break down complex energy data into a clear, digestible format. The tree map design is ideal for illustrating hierarchical data, helping your audience visualize the proportion and relationship between different categories at a glance. This template is the ideal design to promote and get the word out! Customize it extensively to fit your needs—adjust colors for a personalized touch, tweak sizes to highlight key areas, and select the perfect photos or icons from our vast free stock libraries. With Venngage, creating your ideal design has never been easier. Dive in and start crafting an
Related charts
tree map charts
tree map charts
tree map charts
tree map charts
tree map charts
tree map charts
tree map charts
tree map charts
tree map charts
tree map charts
tree map charts
tree map charts