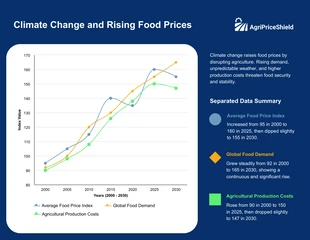
Bar Charts VS Histograms Comparison Table Chart
Unleash Your Creativity: Design Unique Charts and Compare Data with Our Versatile Template
 100% customizable templates
 Millions of photos, icons, charts and graphics
 AI-powered editing features
 Effortlessly share, download, embed and publish
 Easily generate QR codes for your designs
- SizeCustom (1080 x 1350 px)
- File typePNG, PDF, PowerPoint
- Planfree
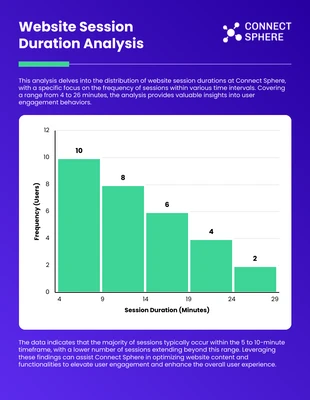
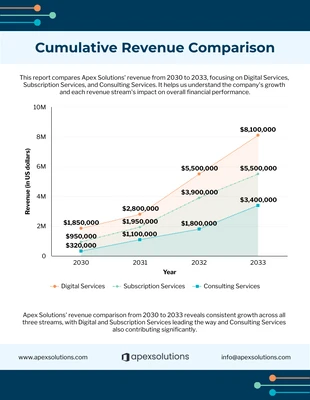
Looking to clarify the differences between bar charts and histograms with ease and style? Our Bar Charts VS Histograms Comparison Table Chart Template is here to help! This user-friendly template is the ideal design to promote and get the word out when explaining these two visual data representations. Customize it to your heart's desire—play around with colors, tweak the sizes, and pick the perfect photos or icons from our vast free stock libraries. Whether you're designing for a presentation, teaching a class, or creating informative content, this template in Venngage gives you the flexibility to create a polished and informative design tailored to your needs. It's all about making the complex simple and visually engaging. So dive in and craft your ideal comparison chart effortlessly!
Related charts
table charts
table charts
table charts
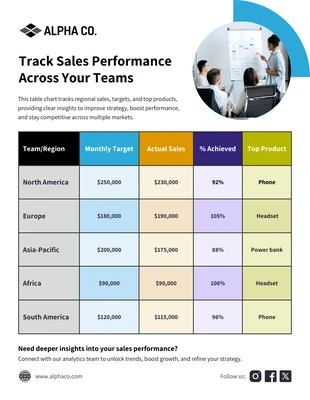
table charts
mixed charts
tree map charts
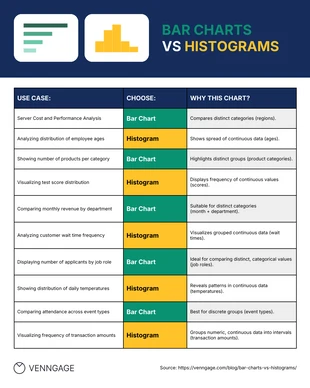
table charts
histogram charts
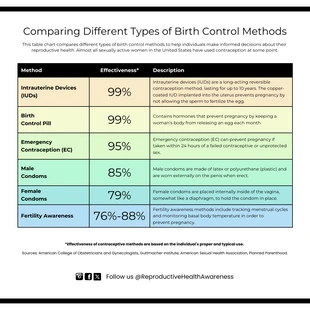
table charts
area charts
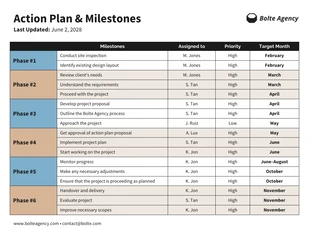
table charts