Free AI Comparison Infographic Generator
Effortlessly create side-by-side comparisons with our AI-powered comparison infographic generator. Visualize data, highlight differences, and simplify decisions—all in just a few clicks.
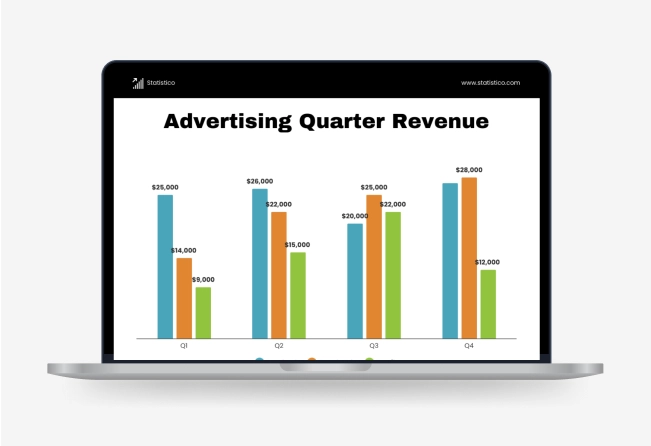
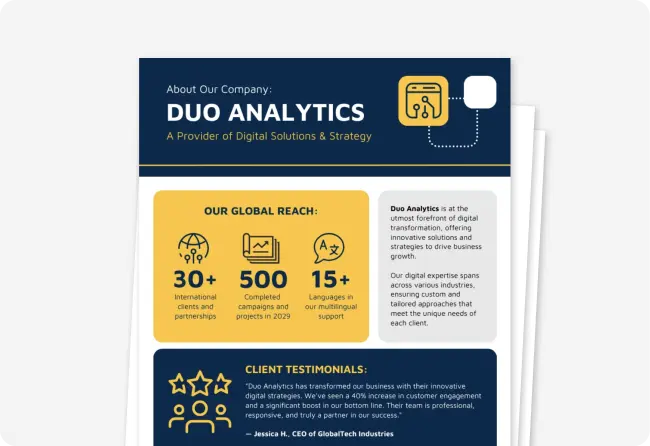
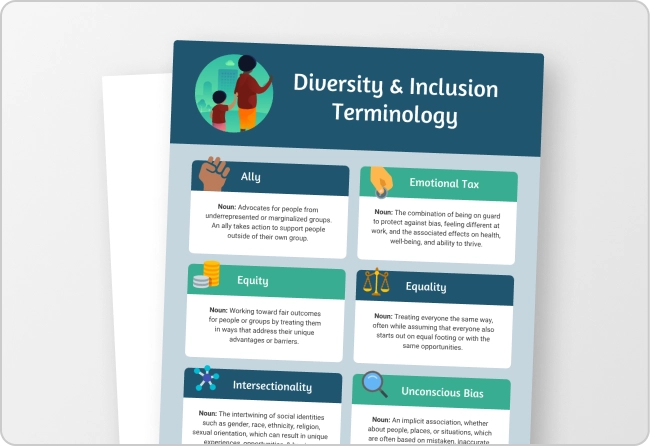
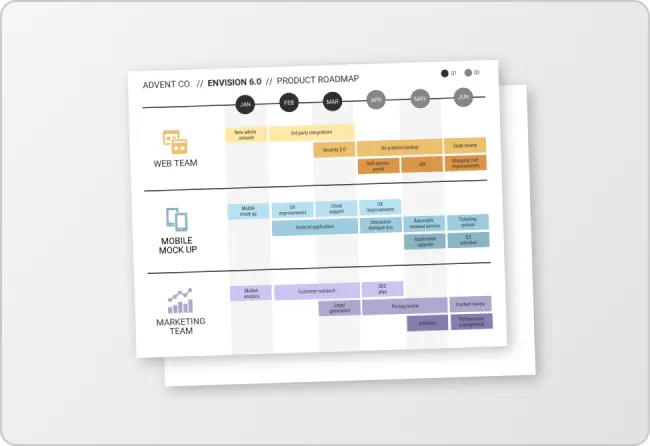
Browse through our AI generated comparison infographic
Explore popular designs
How to write a prompt for the perfect comparison infographic?
Define Your Comparison Criteria: Clearly specify what you're comparing—products, features, services, or data sets.
Choose a Visual Style: Opt for side-by-side, pros and cons, or table layouts for clarity.
Highlight Key Differences:Emphasize essential metrics to make comparisons easy to understand.

Sample prompts you can use
“Compare two smartphones side by side, highlighting battery, camera, and processor with icons and bold text.”
“Create a table-style infographic comparing project management tools by features, pricing, and user ratings.”
“Compare in-house marketing vs. agencies using cost, expertise, flexibility, and ROI with simple visuals.”
“Design an infographic contrasting free vs. premium plans with checkmarks, icons, and color-coded sections.”
How can you create a chart in under 5 minutes?
Step 1: Start with your topic
What will your chart be about? It could be anything from a business meeting to an unusual sighting of an exotic animal. Simply enter your subject to inform the AI of your focus.
Step 2: Select style and tone
Consider the design style you want for your chart, like simple, abstract, geometric, or elegant, to ensure a perfect fit. Then, choose the tone that suits your message, from fun and creative to casual, professional, or formal. Decide how you want to captivate your audience.
Step 3: Define your AI Prompt
For optimal prompts, keep these six tips handy: Define the objective, detail the audience, outline key points, specify style and tone, include visual preferences, and set constraints. E.g. “Chart about remote work culture for HR professionals, green and purple colors”.
Step 4: Edit and customize
Now that you have your slides, feel free to adjust them. Want to change the color scheme or move a text box? Don’t like the text? Customize it freely, however, you want and like! Use Venngage’s online editor's tools to tweak the slides to your preference.
Step 5: Download and share for free
Export your chart in .pdf format and download it at no cost. Excited to share it with friends or colleagues? Create a link for easy sharing!
Instantly create AI-generated comparison infographics for free
Effortlessly design professional comparison infographics with AI. Whether you're comparing products, analyzing market trends, or presenting research, our intuitive tool makes it quick and easy. Just input your data, pick a design and customize the design to match your brand.
No design experience? No problem—our AI-powered generator simplifies the process, turning raw information into clear, engaging visuals in seconds.

Customize your Infographic for clarity and impact
Make your comparison infographic stand out with easy customization. Highlight product differences, market insights, or research findings with flexible design options. Adjust colors, fonts, and layouts to match your brand and improve readability.
Enhance engagement by adding icons, images, and bold typography to emphasize key points. Use contrasting colors and strategic layouts to guide attention. Whether for reports, presentations, or social media, create a clear, impactful infographic that effectively communicates your message.

Export your comparison infographic effortlessly
Make your comparison infographic stand out with easy customization. Highlight product differences, market insights, or research findings with flexible design options. Adjust colors, fonts, and layouts to match your brand and improve readability.
Enhance engagement by adding icons, images, and bold typography to emphasize key points. Use contrasting colors and strategic layouts to guide attention. Whether for reports, presentations, or social media, create a clear, impactful infographic that effectively communicates your message.

Fuel Your Creativity with AI-Powered Design Tools
Venngage is your one-stop shop for creating impactful presentations, infographics, reports, and more. It's a favorite among professionals, educators, and marketers for a reason:
AI Branding Automation
Instantly extract brand colors, fonts, and styles. Auto-apply your logo and visual identity to every design for seamless brand consistency.

DesignAI Generator
Turn simple prompts into stunning professional visuals in seconds. Describe what you need in plain language and watch our AI generate layouts optimized for maximum visual impact.

AI Content Auto-Fill
Kickstart your design process in seconds. Choose a template and let our AI auto-fill it with relevant, on-brand content, ideal for streamlining workflow and boosting productivity.

AI Generated Icons and Images
Create unique visuals that perfectly match your content and style. Generate custom illustrations, icons and images that align perfectly with your brand.

AI Writer and Translation
Enhance clarity, rewrite content, and instantly translate text to create accessible, global-ready visuals.

Smart Accessibility AI
Ensure every project looks great and works for everyone. Use AI to write alt text check contrast, layout, and font readability, and export fully WCAG-compliant visuals and PDFs.

FAQs
Absolutely. All AI-generated templates on Venngage's platform are fully customizable, allowing you to personalize colors, layouts, images, and more to match your unique vision.
Yes, Venngage offers a wide variety of comparison infographic designs to suit different needs and preferences. Whether you're looking for something sleek and modern, or more detailed and data-focused, you'll find numerous options to choose from in our extensive template library.comparison infographic template to suit different needs and preferences. Whether you're looking for something sleek and modern, or more detailed and data-focused, you'll find numerous options to choose from in our extensive template library.
Yes, the AI-generated comparison infographics created using Venngage's tools are copyright-free. You can use them for both personal and commercial purposes without any restrictions on copyright. However, it's always good practice to ensure that any externally sourced content you include is also cleared for use.
You can generate up to 5 comparison infographics for free.